Jakub Siuda
Portrait of Jakub Siuda

Jakub Siuda

Data analyst. I take raw data all the way to a decision someone can act on.

Four years as a technical lead and 3D artist in games taught me to find the bottleneck, measure it and explain it. Now I do it with SQL, Python, Power BI, Tableau and Excel. Based in Bielsko-Biała; open to hybrid or on-site work in Silesia and Kraków, or remote.

Vibration on one machine during 2015, with its control limit and its six comp4 failures The 24-hour average vibration crosses the machine's upper control limit about a day before each of the six comp4 failures, and five more times without a failure. upper control limit JanFebMarAprMayJunJulAugSepOctNovDec over the limit about a day before all 6 breakdowns but also 5 false alarms, so the alert needs a second signal
Over the limit about a day before all 6 breakdowns, but also 5 false alarms, so the alert needs a second signal. Vibration on machine 37 through 2015, from my predictive-maintenance case study. Red marks are comp4 failures; the dashed line is its upper control limit, set from its own January. How I turned this into an alert

Selected work

Each case study starts with a business question and ends with a recommendation. The code, data and write-up are public.

Launch health of Polish-made games on Steam

What does a healthy first 90 days on Steam look like, and which early signals warn a publisher that the rating is going wrong?

  • Collected 754,026 reviews for 23 games through Steam's API and modelled them in PostgreSQL.
  • The score is effectively set in 2 days: days 0–1 predict the days 7–90 score to within 2.9 points, so the rolling score is the real early warning.
  • Players inside Steam's 2-hour refund window are 20 points less positive than everyone else.
  • Chinese players add about 6,500 extra negative reviews, driven by performance and servers, not translation.

Built with Python, PostgreSQL, Power BI (star schema, 19 DAX measures) and Tableau.
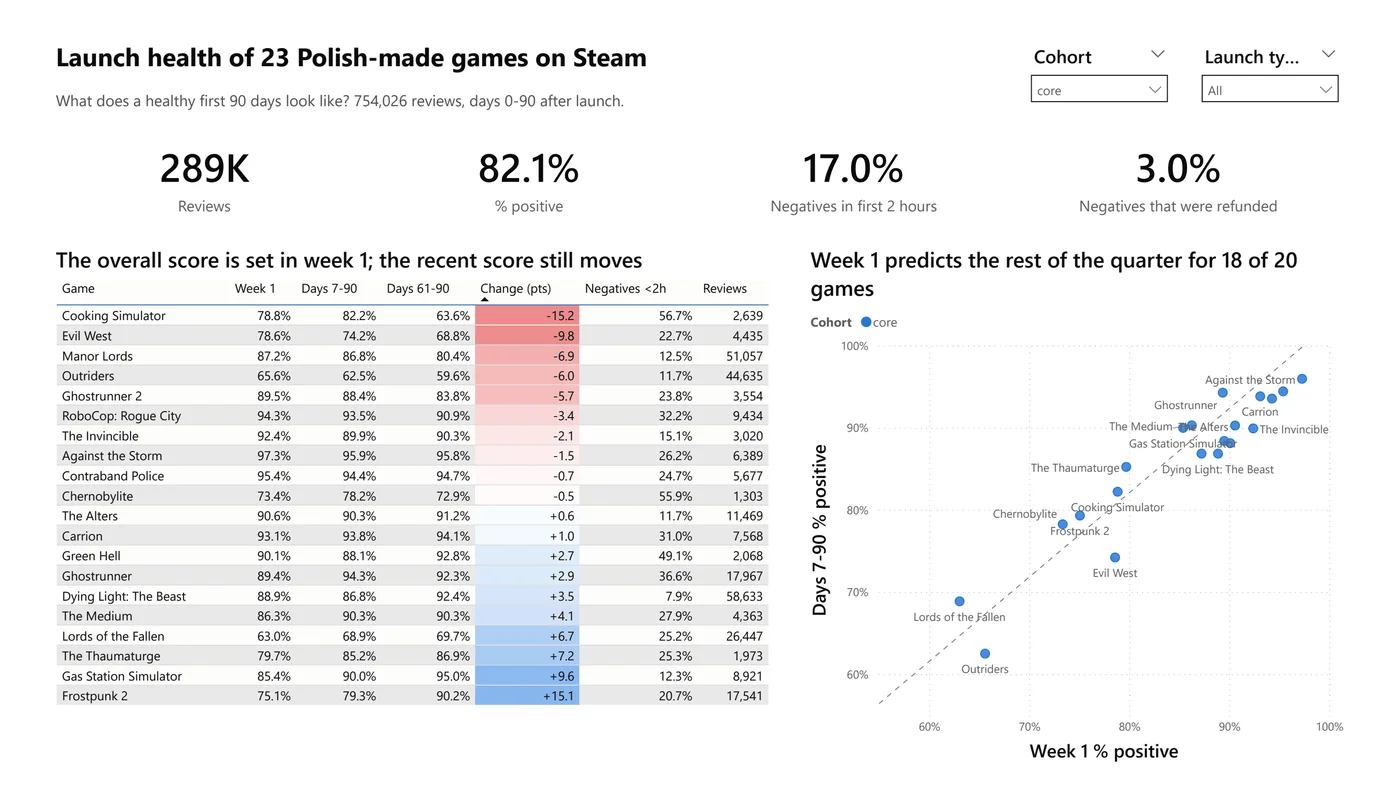
Dashboard: launch health of 23 Polish-made games on Steam, with a table of week 1 against days 7–90 scores and a scatter plot showing week 1 predicts the rest of the quarter for 18 of 20 games.
Overview page of the dashboard (Power BI, also on Tableau Public).

Cutting unplanned downtime on a machine fleet

Where do failures cost a plant most, do the machines warn before they fail, and would acting on those warnings pay off?

  • Per-machine control charts showed each part has its own warning sign about a day ahead.
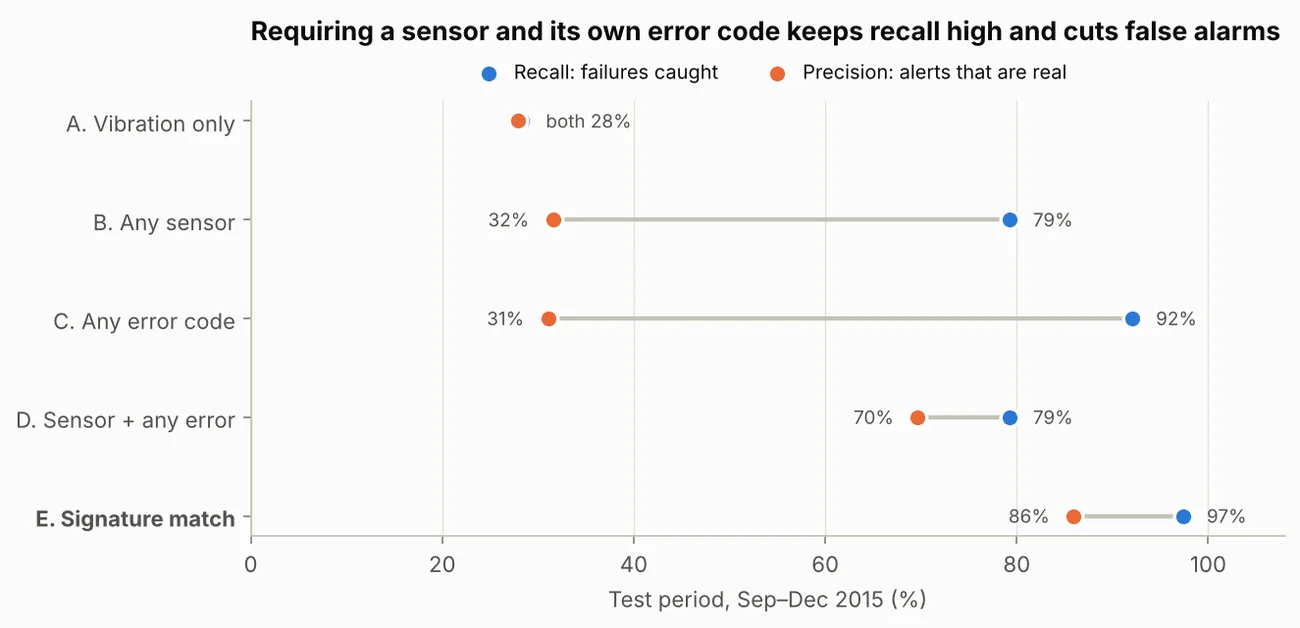
  • A two-signal alert caught 97% of failures, tested on months it was never tuned on.
  • 86% of its alerts pointed to a real problem, with about 19 hours of notice.
  • An Excel business case puts the saving at 11.8 million PLN a year in the base case, and shows when it would not pay.

Built with PostgreSQL, Python and Excel (Power Query, Data Table, Scenario Manager).

Public synthetic dataset: 100 machines, 876,100 hourly sensor readings. Costs in the business case are labelled assumptions.

Chart comparing five alert rules on the test period: requiring a sensor and its own error code keeps recall at 97% and raises precision to 86%, while single-signal rules raise many false alarms.
Five alert rules compared on September–December, data none of them were tuned on.

More analyses

Skills, and where to see them

Every skill below is used in at least one public project, so you can check the work, not just the list.

Skill Steam launches Machine fleet Supply chain Credit risk KPI dashboard
SQLPostgreSQL: window functions, views, data-quality checksUsed in: Steam launches, Machine fleetusedusednot usednot usednot used
Pythonpandas, Matplotlib, REST APIsUsed in: Steam launches, Machine fleet, Supply chainusedusedusednot usednot used
Rtidyverse, ggplot2Used in: Credit risknot usednot usednot usedusednot used
Power BIDAX, star schemaUsed in: Steam launchesusednot usednot usednot usednot used
Tableaudashboards, calculated fieldsUsed in: Steam launches, KPI dashboardusednot usednot usednot usedused
Excel and SheetsPower Query, What-If analysis, scenariosUsed in: Machine fleet, KPI dashboardnot usedusednot usednot usedused
Statisticscontrol charts, correlation, bootstrap, train/test splitUsed in: Steam launches, Machine fleetusedusednot usednot usednot used
Collecting datapublic APIs, logging and validationUsed in: Steam launchesusednot usednot usednot usednot used
Cost modellingunit costs, sensitivity, scenariosUsed in: Machine fleet, Supply chainnot usedusedusednot usednot used

Background

I spent four years making games run well: finding what slowed a pipeline down, measuring it, fixing it and explaining the trade-offs to artists and programmers. Analytics is the same job with better data.

I completed the Google Data Analytics Professional Certificate in 2026, plus short courses in Power BI, Excel, Python and data science. I hold a BA in 3D Animation and VFX for Games and Film from the University of Lower Silesia (DSW), Wrocław.

  • Polish (native), English (fluent)
  • Based in Bielsko-Biała, Poland
  1. 2021 – now 3D generalist and project manager, freelance

    Scoped, scheduled and delivered 3D commissions end to end, including a full music video in Unreal Engine.

  2. 2022 – 2024 Technical lead, Dream Eater Interactive

    Diagnosed performance and rendering problems in two Unity games and optimised the asset pipeline. The link between art and programming, reporting progress and risks.

  3. 2024 – now 3D environment artist, Textures.com

    Photorealistic plant assets for an international library, built to strict technical specifications and quality checks.

  4. 2026 Moving into data analytics

    Google Data Analytics certificate and the case studies on this page. Looking for a junior data analyst role.

Get in touch

I'm looking for a junior data analyst role. The quickest way to reach me is email.

siudajakub@gmail.com